Detecting Live Betting Inconsistencies Through Software Integration in Popular Sports
Written by Kai Zimmermann · Aug 16, 2026
Detecting Live Betting Inconsistencies Through Software Integration in Popular Sports
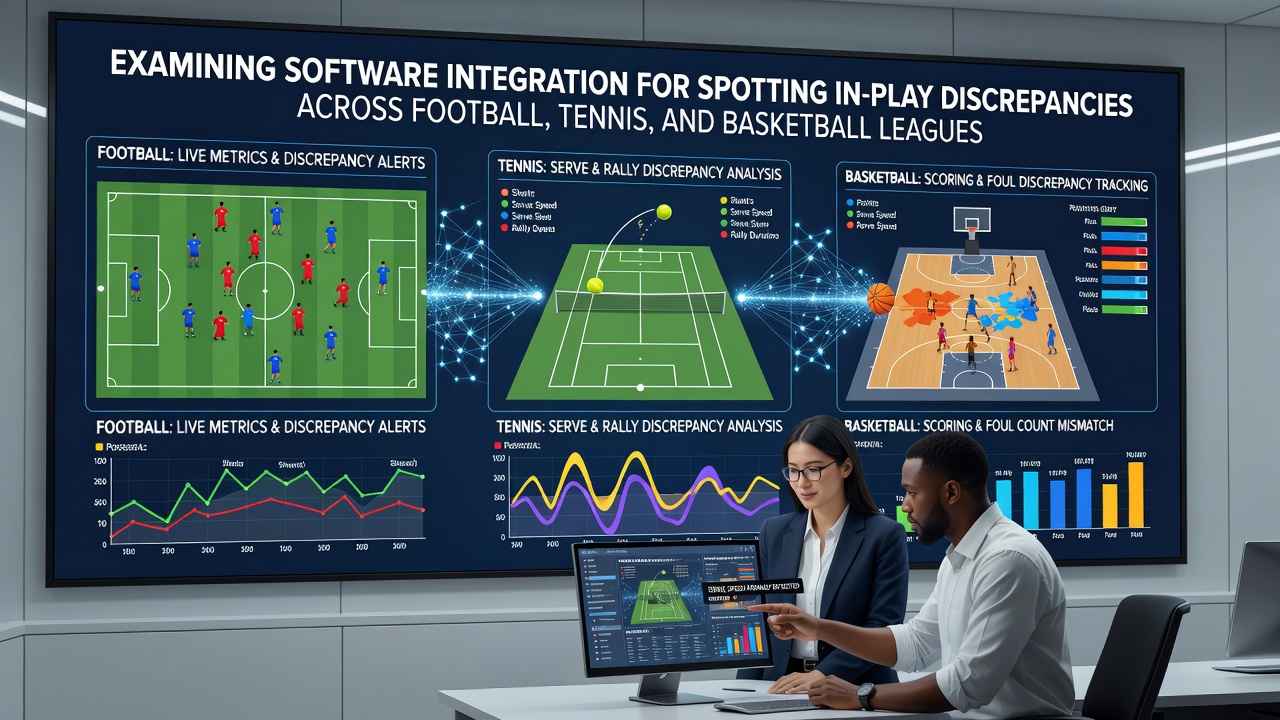
Integrated software systems pull live data feeds from multiple betting operators and sports data providers, then cross-reference those streams to flag odds variations as they develop during matches in football, tennis and basketball, and August 2026 updates to several platforms have expanded coverage to include additional lower-tier leagues in each sport.
Core Components of Integrated Detection Systems
Real-time APIs from bookmakers supply updated odds every few seconds while separate data vendors deliver play-by-play events such as goals, service breaks or timeouts, and the combined pipeline runs these inputs through matching algorithms that calculate expected probabilities based on current match state, then compare those probabilities against the posted odds from each operator to surface any gaps larger than a set threshold.
Developers structure these systems around modular microservices so that new data sources can slot in without rebuilding the entire stack, and observers note that this approach reduces downtime when one provider experiences an outage during high-volume periods such as major tournaments.
Application Across Football Leagues
Football matches generate frequent in-play markets on next goal, corners and cards, and integrated tools monitor these alongside possession and expected goals models to detect when one operator's price deviates from the consensus derived from other books and statistical projections, and data from the 2025-26 season shows that such discrepancies often appear in the minutes immediately following a red card or penalty decision.
Case examples from European domestic leagues illustrate how the software flags a sudden shift in one bookmaker's over/under line while the remainder of the market remains stable, allowing users to review the anomaly within seconds of the triggering event.
Handling Tennis Point-by-Point Volatility
Tennis presents a different pattern because points occur rapidly and momentum can swing after every game, and integrated platforms incorporate serve-percentage models plus fatigue indicators derived from previous sets to recalculate probabilities continuously, then highlight when an operator's live odds lag behind the updated assessment, and researchers at sports analytics conferences have presented findings on how these tools performed during Grand Slam events in 2025.
Because tennis scoring resets after each point, the algorithms must refresh calculations at a higher frequency than team sports, yet the same core discrepancy engine applies once the data streams are normalized.

Basketball In-Play Metrics and Integration
Basketball leagues supply detailed tracking data on shot location, player substitution and pace, and software platforms merge these inputs with betting markets on player performance props and quarter totals, then compare the implied probabilities against live lines from multiple operators, and reports from the European Gaming and Betting Association indicate that integration of optical tracking feeds has increased the number of detectable discrepancies per game by roughly 18 percent compared with box-score-only models.
During the 2025-26 NBA season, several platforms added real-time usage-rate adjustments that account for foul trouble, and those refinements produced earlier alerts when one operator's spread failed to move in line with the updated player-availability probabilities.
Technical Challenges and Data Standards
Latency differences between operators and data vendors can create false positives, so systems apply time-stamp alignment and confidence scoring before surfacing an alert, and industry working groups continue to refine common data formats that allow faster reconciliation across sources, and a 2024 academic paper hosted by the University of Nevada Reno examined how standardized event timestamps reduced erroneous flags by 22 percent in controlled tests.
Security protocols also require encryption of both incoming feeds and outgoing alerts, and compliance teams at platform providers maintain audit logs that regulatory bodies in various jurisdictions can review on request.
Future Developments Expected by Late 2026
Platform providers have announced plans to incorporate additional tracking metrics such as player heart-rate data from wearable devices once leagues approve broader distribution, and these expansions would further refine probability models used for discrepancy detection, and the same modular architecture that supports current feeds is designed to accept the new streams without major rewrites.
Conclusion
Software integration that combines multiple live data sources now forms the backbone of discrepancy detection across football, tennis and basketball, and continued refinement of APIs, event models and timestamp standards supports more precise identification of pricing variations as matches unfold.