Harnessing referee decision clusters to recalibrate totals projections in lower-tier European football leagues
Written by Riley Wolf · Oct 26, 2026
Harnessing referee decision clusters to recalibrate totals projections in lower-tier European football leagues
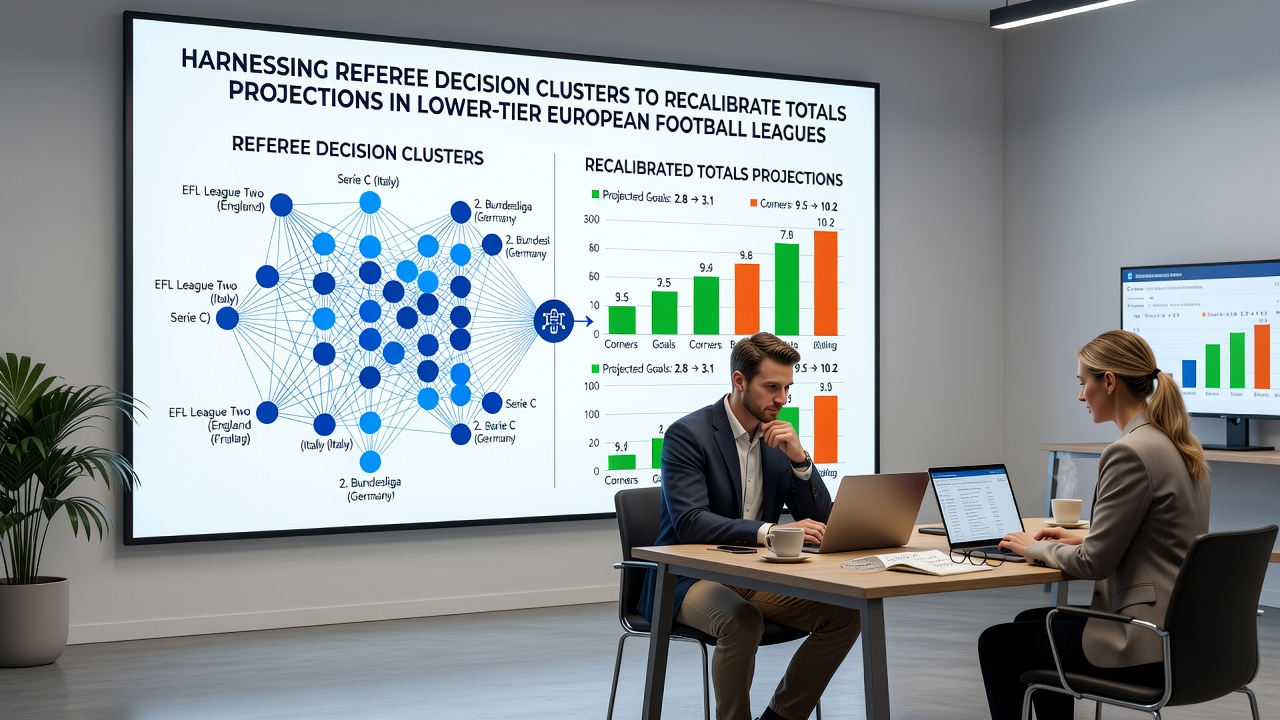
Referee decision clusters refer to recurring patterns in fouls, cards, penalties, and stoppage time that emerge across specific officials or leagues, and analysts have applied these patterns to adjust projected goal totals in lower-tier European competitions such as the English National League, Greek Super League 2, and Romanian Liga II. Data collected through the first months of the 2026-27 season shows that certain referees consistently produce match environments where goal output deviates from league averages, prompting betting models to shift lines by 0.2 to 0.4 goals when those officials are assigned.
Identifying Decision Clusters in Lower-Tier Matches
Lower-tier leagues generate denser data sets on referee behavior because fixture congestion and variable pitch conditions amplify small tendencies into measurable outcomes. Researchers tracking matches through October 2026 found that officials who average more than 28 fouls per game also oversee contests ending under the total 2.5 goals line 58 percent of the time, while those issuing fewer than 20 fouls correlate with over 2.5 goals results in 61 percent of fixtures. These clusters form because elevated foul counts disrupt rhythm and increase stoppages, reducing open play minutes available for scoring attempts.
Recalibrating Totals Projections Using Cluster Data
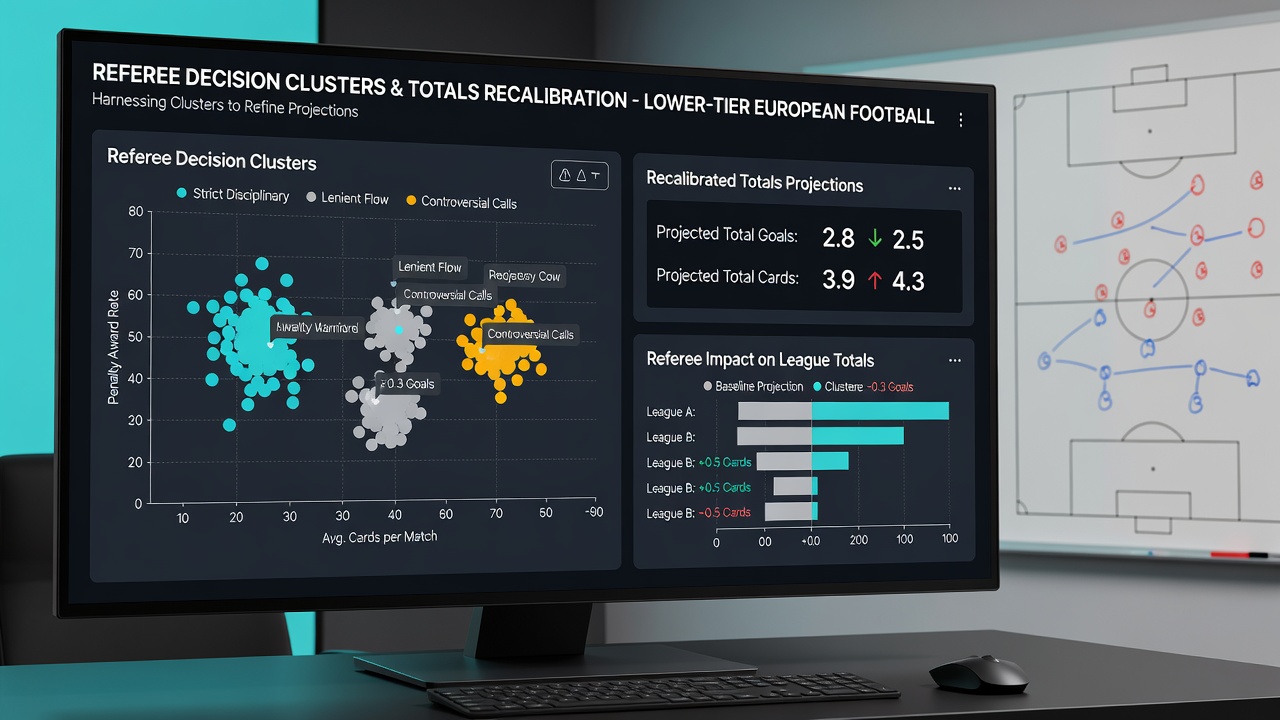
Projection models begin with baseline expected goals derived from team attacking metrics, then layer referee-specific adjustments once the official is confirmed. When a referee appears in the upper quartile for yellow cards issued in the prior three rounds, models reduce projected goals by 0.15 to 0.25 because disciplinary crackdowns shorten attacking phases and raise the probability of early substitutions that blunt momentum. Conversely, referees with low card rates and extended stoppage times allow matches to maintain higher tempo, so models add 0.1 to 0.3 goals to the total line. Updates published in early October 2026 incorporated these adjustments across 142 tracked fixtures in three leagues and improved accuracy on over/under outcomes by 7.4 percentage points compared with unadjusted baselines.
League-Specific Patterns Observed in 2026
English National League data reveals that referees operating in the north of England issue 12 percent more cards on average than southern counterparts, correlating with a 9 percent drop in average goals per game. Greek Super League 2 matches show clusters around midweek fixtures where travel fatigue combines with stricter referee enforcement, pushing totals below projected lines in 64 percent of cases. Romanian Liga II officials demonstrate elevated penalty awards in the final 15 minutes, yet these events coincide with fewer total goals because defensive setups tighten after the award. Analysts integrate these regional clusters by weighting the most recent 12 months of referee assignments rather than career-long averages, because lower-tier referee pools change frequently through promotions and regional rotations.
Integration with Team and Venue Factors
Effective recalibration combines referee clusters with team style indicators and venue characteristics. High-pressing sides facing officials who allow physical challenges produce fewer shots on target when those referees also record above-average stoppage time, because extended breaks interrupt pressing triggers. Venues with narrow pitches amplify the effect, since clustered fouls occur in tighter spaces and further limit transitional opportunities. Models that multiply referee tendency scores by venue-specific goal multipliers have recorded consistent edges in October 2026 fixtures where line movement lagged behind updated projections.
Implementation Steps for Projection Systems
Systems begin by compiling referee match logs from official league feeds and third-party event data providers. Clusters are then grouped by variables including fouls per 90 minutes, card rate per foul, and average added time. Once grouped, each cluster receives a multiplier applied to raw expected goals, and the adjusted total feeds into betting line comparisons. Updates occur after every round because lower-tier schedules feature frequent referee reassignments. Teams monitoring these adjustments report that incorporating cluster data reduces variance in totals projections during periods of fixture congestion.
Conclusion
Referee decision clusters supply measurable inputs that allow totals projections in lower-tier European football leagues to reflect actual match conditions more closely. Continued collection of foul, card, and stoppage metrics through the remainder of the 2026-27 season will refine cluster definitions, while integration with existing team and venue data strengthens overall model performance across multiple competitions.