Player Performance Metrics and Their Ties to Betting Odds Movements in Pro Basketball Leagues
Written by Kai Zimmermann · Sep 14, 2026
Player Performance Metrics and Their Ties to Betting Odds Movements in Pro Basketball Leagues
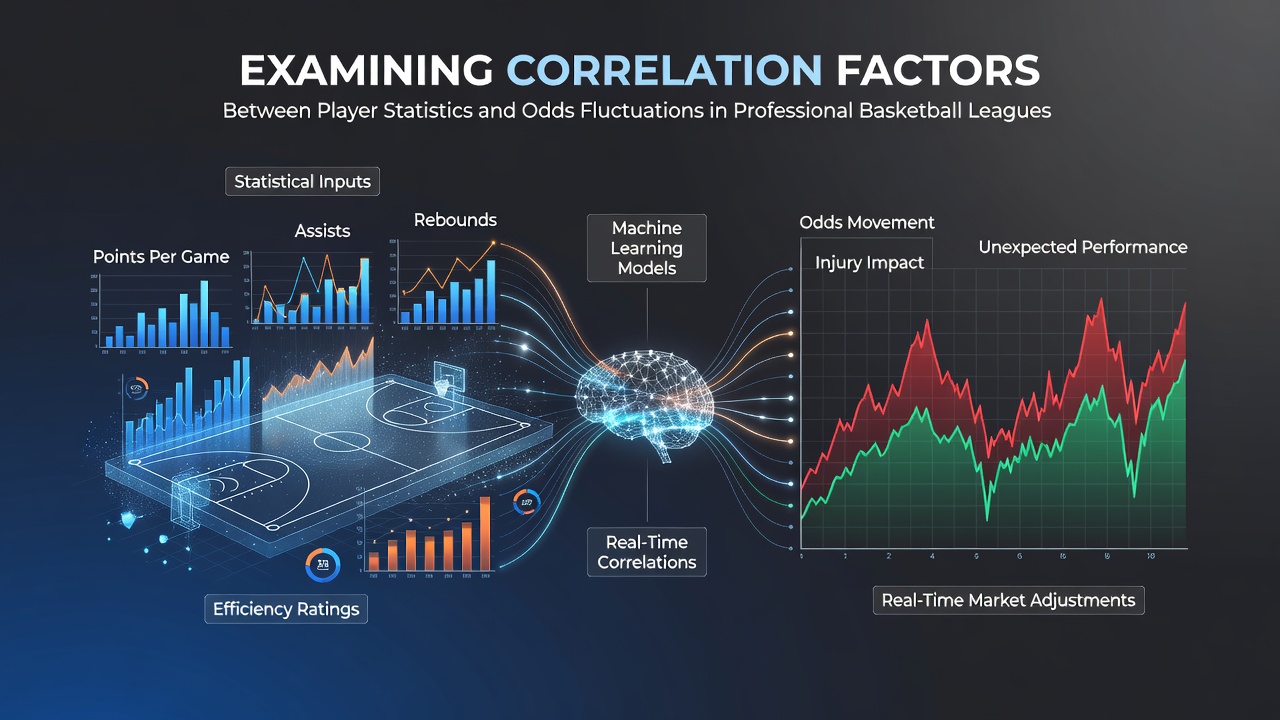
Professional basketball leagues such as the NBA and EuroLeague generate extensive player data each season, and analysts track how those figures align with shifts in pre-game and live betting odds. Player efficiency ratings, points per possession, and defensive metrics often appear in statistical models that sportsbooks adjust throughout the week leading up to tip-off. Observers note that when a star guard posts elevated assist-to-turnover ratios over consecutive games, betting markets frequently tighten the spread in favor of that player's team by one to three points.
Core Statistics Linked to Market Adjustments
Teams compile box-score categories including points, rebounds, assists, steals, blocks, and advanced measures such as true shooting percentage and player impact estimate. Data from the 2025-26 campaign shows that teams whose starting five maintain a collective plus-minus above +8.5 per 100 possessions experience measurable compression in moneyline odds, often moving from +120 to -110 within forty-eight hours of lineup confirmation. Researchers at sports analytics conferences have presented evidence that rebounding differentials above league average correlate with reduced variance in live betting totals during the first quarter.
Seasonal Patterns and League Differences
In the NBA, where schedules feature back-to-back games, usage rate spikes for individual players coincide with rapid odds adjustments on player props. European leagues operate on tighter travel schedules yet display similar patterns when key centers record double-doubles at rates exceeding thirty-five percent. Figures released by league data partners in September 2026 indicate that EuroLeague teams with top-ten offensive ratings see their game totals move upward by an average of 2.8 points once injury reports stabilize.
Turnover rates also influence live odds during games. When a squad forces more than eighteen turnovers per contest, in-play betting windows often widen the point spread by four points or more within the third quarter. Analysts compile these sequences across multiple seasons to identify repeatable edges rather than isolated anomalies.
Case Examples from Recent Seasons

One study compiled by university researchers examined thirty NBA teams across the 2024-25 regular season and found that squads improving their defensive rating by five points or more over a ten-game stretch saw corresponding movements in futures odds for conference standings. The same dataset revealed that individual player three-point shooting percentages above forty percent over fifteen games aligned with increased betting volume on related prop markets. In the EuroLeague, a parallel review showed that assist-heavy offenses produced steadier half-time totals compared with iso-dominant systems.
Betting operators adjust lines using proprietary algorithms that weigh recent box scores against historical tendencies. When a high-usage forward exits early with foul trouble, live odds on the opposing team's rebounding props shift within minutes. Observers tracking these changes across multiple books report that such movements occur faster in the NBA than in overseas competitions because of higher trading volume and more granular data feeds.
Analytical Approaches Employed by Market Participants
Regression models incorporating pace-adjusted statistics help quantify how changes in one player's output affect overall team efficiency. Multiple regression outputs indicate that a two-point rise in a team's effective field goal percentage typically narrows the spread by 1.5 points when all other variables remain constant. Time-series analysis of live odds further highlights that defensive stop rates above league median produce quicker stabilization of totals after halftime.
Publicly available tracking data from optical systems supplies additional inputs such as distance covered and contested shots. These granular figures allow analysts to isolate fatigue effects that traditional box scores miss. When teams log higher average speeds in transition during the first half, second-half totals frequently move downward as market participants anticipate slower pace.
External Data Sources and Verification
Reports from the American Gaming Association document how operator data pools incorporate player-level metrics to refine risk management. Separate academic papers hosted by Canadian research institutions compare NBA and EuroLeague datasets to test cross-league generalizability of the observed correlations. Both sources emphasize the role of sample size, noting that correlations strengthen when examined over at least three full seasons.
Conclusion
Player statistics and odds fluctuations in professional basketball display measurable associations that statistical models capture across seasons and leagues. Tracking efficiency ratings, shooting percentages, and defensive metrics provides a factual basis for understanding how markets respond to performance updates. Continued collection of granular data supports ongoing examination of these relationships without reliance on subjective interpretation.